INTRODUCTION
Dynamical systems play an important role in many scientific fields, but models of such systems can feature many parameters and variables that are confusing to first time users. Fovea is a python package for assisting researchers in the process of building intuition about dynamical systems implemented in algorithms. The package consists of five files.
1. graphics.py
Fovea graphics provides a set of tools allowing the user to visualize the action of dynamical systems as they evolve over time, or as their parameters change. It adds a new level abstraction, called a Layer to the graphical inheritance structure used by Matplotlib.
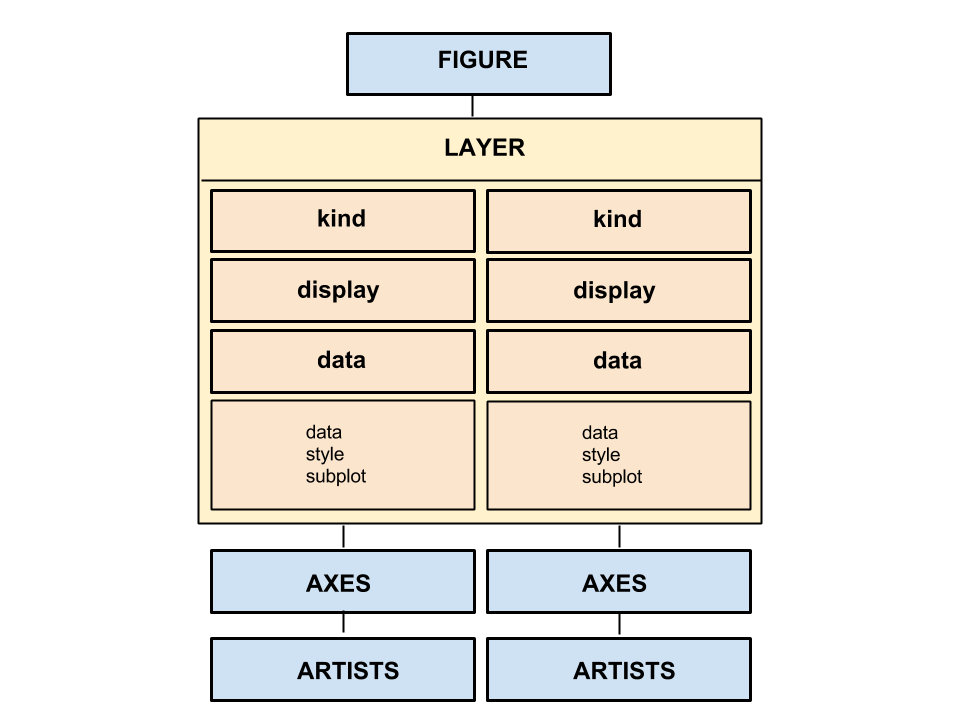
Layers exist as a way of of grouping together related data and meta-data so they can be manipulated together graphically. Each layer includes a number of attributes such as:
data
numpy array of numeric data
dynamic
boolean variable
zindex
style
Maximum two character string indicating color and/or style of plotted data (e.g., "r." for a red dot)
display
boolean determining visibility of layer
axes_vars
List of strings labeling each axis.
handles
Ordered Dictionary of mpl handles belonging to artists in the layer. The keys correspond to names of the data stored in the data field (i.e., they should have a one-to-one correspondence with layer_struct.data.keys after the artist has been drawn with a call to buildLayer), each valued with a single matplotlib object. An ordered dictionary is used to facilitate cycling between handles in a single layer with keypresses (see the section on navigation callbacks for more information). ISSUE: Because it reuses the same keys as data, it may make more sense to store handles at the data-level, rather than the layer-level.
trajs
A dictionary of PyDSTool Trajectories belonging to artists in a layer. The keys correspond to names of the data stored in the 'data' field, each valued with a single PyDSTool Trajectory created by the internal function _updateTraj().
scale
kind
string indicating kind of information displayed in this layer (e.g., "text", "data").
The attributes 'kind' and 'data' are related and especially import. 'Kind' determines the type of data that can be stored in the 'data' field, which is itself a dictionary of fields. For instance, a layer whose 'kind' is "patch" can contain multiple 'datas' (e.g., labeled 'data1', 'data2' and 'data3'), each featuring a 'patch' key whose value is a different matplotlib.patch object. The result could be data in 'data1' plotted as ellipses, data from 'data2' plotted as squares, and data from 'data3' plotted as triangles.
The fields of the 'data' attribute of layers includes:
data:
The raw data itself. This can be a numpy array containing numerical data or a LineCollection object. For non-numeric objects one wishes to display in the axes (such as matplotlib patches), the data field stores the position of the object.
style:
String. The color and linestyle used to plot the raw data, following matplotlib's coding scheme (e.g., 'k-' will produce a black line).
subplot:
String. If the parent Layer of the data has been assigned to different subplots, this field is used to specify upon which axes the child dataset should be plotted. (e.g., '11' for the the subplot in the first row and first column)
graphics.py includes two main classes for managing GUIs, Layers, and the graphical objects stored inside them:
plotter2D creates the graphical components for specific calculations. It can be used to create and store new figures and Layers and generates artists placed upon them (data, text, axis lines, etc.). For example, two Layers containing clusters of data points observed during two separate experiments may be created and entitled as ‘exp1_data’ and ‘exp2_data’ using separate calls to the method addLayer, then the boundaries of the figure containing these layers may be resized with the method auto_scale_domain. The following code snippet demonstrates how layers can be initialized in a single axes object and used to store different types of data:
plotter = gui.plotter

#Create a root figure
plotter.addFig('Master',
    title='Project Title',
    xlabel='x', ylabel='y',
    domain=([0,10],[-2,1.5]))

#Add layers to Master figure with titles.
plotter.addLayer('exp1_data', figure = 'Master')
plotter.addLayer('exp2_data', figure = 'Master')

#Create a single axes object at 11, containing our layers.
plotter.arrangeFig([1,1], {'11':
    {'name': 'Two Experiments',
    'scale': ([0,10],[-2,1.5]),
    'layers': ['exp1_data','exp2_data'],
    'axes_vars': ['x', 'y']}
    })

gui.buildPlotter2D((8,8), with_times=False)

#Add list data to our layers.
plotter.addData(dataset1, layer='exp1_data', style='k-')
plotter.addData(dataset2, layer='exp2_data', style='r-')

plotter.auto_scale_domain(figure='Master')
plotter.show()
Note also that Plotters can be initialized with a diagnostic manager object, which ensure saves are stored on a path visible to the diagnostics tools.
diagnosticGUI takes an instance of plotter2D in its constructor and provides user-interactivity with the graphics created by that instance. It creates appropriate widgets that can be used for exploring models (such as a slider for incrementing and decrementing time steps) and provides button callbacks for clicking on the axes. For example, the method getDynamicPoint lets the user click a subplot and store the point clicked on a clipboard for later access.
Turning Layers into Graphics
From the user's perspective, Layers may be thought of as transparent slides that are placed over one another on an axes subplot. But more accurately, a Layer is a set of instructions telling the plotter what artists should be created on which subplots with which properties. These specifications are stored in the layer structure described above and consolidated in plotter2D.buildLayer. When called with @param force set to true, buildLayer clears all artist handles from the given layer (@param lay), then loops through each data struct found in lay.data. The function uses the layer kind (lay.kind) to determine how each data item should be converted into an artist on the axes. If an artist for the data item by that name has already been created (i.e., an entry exists for that name in lay.handles), it will be replaced. Alternatively, if @param force is False, the current artists will not be cleared, and new artists will not replace older artists keyed with the same name.
Layers currently support four different kinds: 'data', 'text', 'patch' and 'obj'. Each one has a corresponding plotter2D method for adding artist specifications to the list of instructions that is the layer structure.
addData
Accepts a pair of sequences in [x, y] format (@param data), which are eventually converted into a matplotlib.lines.line2D in buildLayer with a call to mpl's plot() function. Given three numeric sequences [x, y, z] for @param data, addData will create 3-dimensional data, but the 'projection' type of the axes must be set to '3d' in the call to plotter.arrangeFig for 3d plotting to work. A mpl.collections.LineCollection object can also be provided for @param data, in which case, buildLayer will add an artist to the axes with .add_collection.
addData is also unique in that calling this method will create a PyDSTool Trajectory object that underlies the data added. The internal method ._updateTraj() called by addData() will convert @param trajs (a PyDSTool Pointset given to addData) into a Trajectory stored as a value in the .trajs field of the given layer's struct. If @param trajs is None, a traj is created with the PyDSTool method numeric_to_traj from @param data. Trajs allow the snap callback to locate a point on the data.
addText
Takes a string for @param text to be displayed at [x, y] coordinates @param data. The text will eventually be created on the given axes with a call to mpl's .text() method. If @param use_axis_coords is True, the [x, y] position is treated as a fraction of the length of the x and y limits of the axes (i.e., @param data = [0.5, 0.5] will produce place the text in the center of the axes, [1, 0] in its bottom-right corner, [1, 1] in its top-right, etc.'). If use_axis_coords is false, the position of the text is simply at that position on the axes (so if you want to label a data point with a bit of text, they can have the same values for lay.data.data).
addPatch
Like addData, this method accepts a pair of [x, y] sequences. Each pair in the sequence specifies the position of a patch to be created from the parameter @param patch, which should itself be a callable matplotlib patch object. In buildLayer, matplotlib's add_artist is called with @param patch (with addPatch's kwargs as its arguments)
ISSUE: Currently, addPatch assumes a 'radius' keyword has been provided and will only work for patches that use this keyword (such as circles).
addObj
Similar behavior to addPatch, except @param obj replaces @param patch, and can be any callable object. It has only been tested for instances of obj = mpl.lines.line2D and obj = mpl.patches.Rectangle. Currently only used to created context objects (box_GUIs and line_GUIs).
ISSUE: I might suggest merging addPatch and addObj into a single function, since both exist to create a chosen mpl object at the positions specified in data with some kwargs. Alternatively, it might be useful to rename addObj to addConObj and include some error handling to ensure it's only used to create context objects, since that's what it's being used for now.
Parameters shared by each add method include the figure, layer and subplot the artists should appear in. The parameters figure and layer will accept only the string name of the given structure, but subplot can be given either a string (e.g., '11' for the top-left subplot, or '21' for the bottom-left on a 4-by-4 grid), or the matplotlib axes object located on the figure. Note that, when given an axes object, the add methods will translate it into a subplot-string before storing it in the data's structure. The subplot can also only be specified when the given layer has been added to multiple subplot's in the call to arrangeFig. If a layer occurs in multiple subplots, but @param subplot is left as None, the artist will default to the first subplot its layer belongs to.
A few other add methods are included for the user's convenience. The following methods don't have their own layer type, but instead wrap addData.
addLineByPoints
addPoint
addVLine
addHLine
Once the data and layer structures have been specified with calls to plotter2D's different add methods, the graphics can finally be displayed with buildLayer. However, plotter2d.show() will typically be the calling function of buildLayer, as it loops through each subplot in the arrangement and each layer in the figure applying all the changes specified by the different add and set methods. In summary, addData, addText, addPatch, and addObj create specifications for graphical objects to be displayed, but the actual execution of these specifications occurs in show().
The properties of figures, layers, and data can be changed after having been added to the plotter using the plotter2D "set" methods:
setFig
Sets the current figure to that named by @param label. kwargs can be included to adjust specific properties of the figure.
setLayer
Change the values of layer attributes with kwargs (e.g., style, handles, display). Note that setDisplay() and toggleDisplay() can also be used to change a layer's display attribute.
setData2
Change attributes associated with data. Currently Fovea includes two methods, setData and setData2, but the original setData will be phased out in a future version. The code snippet below illustrated the difference between calls to the two methods:
OLD VERSION:
gui.setData(layname, data={dname: {'data': [float_a, float_b], 'style':'b--', 'display': True}}, display=True)
NEW VERSION:
gui.setData2(dname, layer= layname, data = [float_a, float_b], style = 'b--', display=True)
Whereas setData is essentially a repackaging of setLayer where the user must supply a new dictionary to update data, setData2 allows the user to change data attribute directly as keyword arguments.
Adding PyDSTool Pointsets
In the previous section, we saw how different plotter2D add methods can be used to create the specifications of artists to be displayed in a Fovea GUI. Due to the importance of adding data to layers and the repition with which these methods will be called, the diagnosticGUI method addDataPoints() is included to add multiple different kinds of artist simultaneously. In other words, diagnosticGUI.addDataPoints() attempts to translate any type of inputs it receives into the specifications in a layer's structure.
In the simplest case, if @param data is a numpy array or a 2 or 3 dimensional list, addDataPoints() acts as a wrapper function, calling plotter2D.addData() with addDataPoints()'s arguments.
The bigger appeal of addDataPoints() is using it to convert PyDSTool Pointsets into different types of artists. Because a Pointsets is essentially a list of named arrays with arbitrary names provided by the user, @param coorddict is used to specify how each dimension in the Pointset is supposed to be used to create an artist. They keys of coorddict should be the names of only those dimensions of the Pointset the user wishes to be represented graphically. For instance, a Pointset may include dimensions for x and y positions of a trajectory (named 'posx' and 'posy' respectively), in addition to the velocity of that trajectory (named 'velx' and 'vely') at each timestep. If the user wishes to plot out the trajectory and a graph of its changing velocity (while perhaps not including some fifth, irrelevant variable 'var' from the graph), they do this by adding each desired variable as a key in coorddict.
coorddict = {'posx': {inner_dict}, 'velx': {inner_dictionary}}
Note that even though the dimensions 'posy' and 'vely' require graphical representation, they are not included as keys in coorddict, because they will belong to the same objects as 'posx' and 'velx' respectively. To specify that these variables are to be treated as the 'y' dimensions of 'posx' and 'posy', they can be added as values of the 'y' keywords in the inner_dicts shown above like so:
coorddict = {'posx': {'y': 'posy'}, 'velx': {'y':'vely'}}
This is equivalent to writing:
coorddict = {'posy': {'x': 'posx'}, 'vely': {'x':'velx'}}
Or even the more redundant:
coorddict = {'posx': {'x': 'posx', y': 'posy'}, 'velx': {'x':'velx', y':'vely'}}
In addition to the 'x' and 'y' keywords already shown, the values of coorddict can be keyed with the following:
'name'
The name of the data structure to be added by the plotter.
'layer'
The layer to which the data are to be added. Unlike plotter.addData, addDataPoints call add a new layer to the plotter if the value of this key doesn't currently exist.
'style'
The style in which the artist should be displayed.
'object'
The type of artist to be displayed. If left empty, addDataPoints() will use addData() to display scatter or line data. Also currently accepts the string 'circle' to use addPatch() to create an instance of a pyplot circle. The string 'collection' is also an admissable value, and will add a lineCollections to the axes using addData()
'map_radius_to'
The value belonging to this key must specify the name of the Pointset dimension (@param data) to which the given coorddict key should be used as the radii parameter. Only applicable when the coorddict key's value includes {'object':'circle'}.
The following code example demonstrates an instance in which the 'map_radius_to' parameter might be used. Here, 'px' and 'py' are the plotting variables specifying the positions of a series of circles, whereas 'radii' is a sequence of numbers specifying the radius of each circle:
from PyDSTool import *

bodsPoints = Pointset({'coordarray': np.array([[self.pos[i][0] for i in range(len(self.pos))],
    [self.pos[i][1] for i in range(len(self.pos))],
    [self.radii[i] for i in range(len(self.radii))]]),
    'coordnames': ['px', 'py', 'radii']})
coorddict =
    {'px':
        {'x':'px', 'y':'py','layer':'bodies','name':'bods1', 'style':'g', 'object':'circle'},
    'radii':
        {'map_radius_to':'px'}
    }
diagnosticGUI.addDataPoints(bodsPoints, coorddict=coorddict)
ISSUE: It might make more sense if 'map_radius_to' was changed to make 'radii' and would behave like so:
coorddict =
    {'px':
        {'x':'px', 'y':'py','layer':'bodies','name':'bods1', 'style':'g', 'object':'circle', 'radii':'radii'},
    }
Once this format is used to create specifications of how the plotter should use each dimension of the Pointset input, multiple datasets of different types can be plotted with a single call to addDataPoints(). The following code snippets both plot the same artists, but demonstrate the difference between adding data at the diagnosticGUI level (with addDataPoints) and adding data at the plotter2D level (with addData).
Using plotter.addData:
plotter.addLayer('V')
plotter.addData([trajPts['t'], trajPts['V']], layer='V', style='k-',
                name='V')
plotter.addData([trajPts['t'], trajPts['vinf']], layer='V', style='k:',
                name='Vinf')

plotter.addLayer('activs')
plotter.addData([trajPts['t'], trajPts['Na.m']], layer='activs', style='g-',
                name='m')
plotter.addData([trajPts['t'], trajPts['Na.minf']], layer='activs', style='g--',
                name='minf')

plotter.addData([trajPts['t'], trajPts['K.n']], layer='activs', style='r-',
                name='n')
plotter.addData([trajPts['t'], trajPts['K.ninf']], layer='activs', style='r--',
                name='ninf')

plotter.addData([trajPts['t'], trajPts['tauv']], layer='activs', style='b:',
                name='tauv')
plotter.addData([trajPts['t'], trajPts['Na.taum']], layer='activs', style='g:',
                name='taum')
plotter.addData([trajPts['t'], trajPts['K.taun']], layer='activs', style='r:',
                name='taun')

plotter.show()
Using diagnosticGUI.addDataPoints:
coorddict = {'V':
                {'x':'t', 'y':'V','layer':'V','name':'V', 'style':'k-'},
             'vinf':
                {'x':'t', 'y':'vinf','layer':'V','name':'Vinf', 'style':'k:'},
             'Na.m':
                {'x':'t', 'y':'Na.m', 'layer':'activs', 'name':'minf', 'style':'g--'},
             'Na.minf':
                {'x':'t', 'y':'Na.minf', 'layer':'activs', 'name':'minf', 'style':'g--'},
             'K.n':
                {'x':'t', 'y':'K.n', 'layer':'activs', 'name':'n', 'style':'r-'},
             'K.ninf':
                {'x':'t', 'y':'K.ninf', 'layer':'activs', 'name':'ninf', 'style':'r--'},
             'tauv':
                {'x':'t', 'y':'tauv', 'layer':'activs','name':'tauv', 'style':'b:'},
             'Na.taum':
                {'x':'t', 'y':'Na.taum', 'layer':'activs','name':'taum', 'style':'g:'},
             'K.taun':
                {'x':'t', 'y':'K.taun', 'layer':'activs','name':'taun', 'style':'r:'}
             }
gui.addDataPoints(trajPts, coorddict = coorddict)

gui.show()
Although learning to construct coorddicts properly takes a bit of effort, addDataPoints simplifies the process of adding data to Fovea GUIs considerably, both by making the code more readable, and removing the need to addLayer excessively. For more information on the Pointsets demonstrated in the above code snippets, see the Hodgkin-Huxley demo in HH_simple_demo.py in examples/HH_neuron.
GUI vs. Plotter
Together, diagnosticGUI and plotter2D provide the front and back ends of Fovea. The GUI class is intended as the user's point of entry to the system. It provides addDataPoints() to enter pointSet data that may later be visualized with the plotter and comes built in with a number of "basic" widgets (the save, capturePoint, refresh and back buttons), which can be hidden by setting the optional parameter "basic_widgets" as False when the display is initialized with buildPlotter2D(). The suite of basic widgets can also be extended with the addWidget() method, which saves the user the trouble of creating widget objects with matplotlib and adding them to GUI figures directly. For instance, a slider object (ranging from -10 to 10 and initialized at 0) can be added to the figure and connected to the user's callback (self.slideCallback):
gui.addWidget(Slider, callback=self.slideCallback, axlims = (0.1, 0.055, 0.65, 0.03),
    label='my_slider', valmin= -10, valmax= 10,
    valinit= 0, color='b', dragging=False, valfmt='%2.3f')
The overall design of diagnosticGUI emphasizes features general to any application, while giving the user the flexibility to patch in their own extensions. Another example is the key_on() method, which defines hotkeys and connects each to a callback (such as mouse_event_snap() in diagnosticGUI and RectangleSelector in matplotlib). Some of these key commands tie into functions defined in the user's application. diagnosticGUI.assign_user_func() takes a callable, such as a function created by the user, and stores this as an attribute of the GUI. This callable (user_func) will then be used by mouse_event_user_function() connected in key_on().
Although the actions of plotter2D are largely intended to take place within the context of a GUI object, in advanced applications it may be necessary to set properties and give commands to the plotter directly. Currently, layers are implemented as a struct (layer_struct) whose fields are the layer's attributes (e.g. data, style, axes_obj) is an instance of plotter2D. Any of these properties can be set with plotter2D.setLayer(), which along with addLayer(), provide the user (at the command line or in user-functions) direct control over how data are displayed and managed in a GUI's subplots.
To curtail excessive calls to the plotter within the user's application, a number of wrapper methods and convenience functions have been defined for diagnosticGUI. The previous example for setting up a Fovea scenario can be simplified using these methods as follows:
from fovea.graphics import gui

#Create a root figure
gui.addFig('Master',
    title='Project Title',
    xlabel='x', ylabel='y',
    domain=([0,10],[-2,1.5]))

#Create a single axes object at 11, containing our layers.
gui.setup({'11':
    {'name': 'Two Experiments',
     'scale': ([0, 10], [-2, 1.5]),
     'layers': ['exp1_data', 'exp2_data'],
     'axes_vars': ['x', 'y']}
    },
    size= (8, 8), with_times= False)

#Add list data to our layers.
gui.addDataPoints(dataset1, layer='exp1_data', style='k-')
gui.addDataPoints(dataset2, layer='exp2_data', style='r-')

gui.show()
Notice that the previous calls to plotter.addFig() and plotter.show() have been replaced with the equivalent gui.addFig() and gui.show() and gui.addDataPoints() now takes the place of gui.addData(). Furthermore, the calls to plotter.addLayer() have been removed altogether. Instead addDataPoints(), upon receiving 'exp1_data' and 'exp2_data' as layer arguments, understands that these are new layers to be added to the plotter and calls plotter.addLayer() internally. gui.setup() also combines plotter.arrangeFig() and plotter.buildPlotter2D() into a convenient function, as these two methods will often be called together. An added benefit to using gui.setup() is that it is no longer necessary to specify the shape of the figure arrangement explicity. The function looks at the keys of arrPlots (its first positional argument) and infers the largest row column values should define the shape of the figure. For example, if the keys of the dict passed into gui.setup() are '11', '12', '21', '22', the figure will be arranged 2-by-2.
Importing vs. Subclassing
When you are ready to use Fovea in your own setting, you have the option of importing a vanilla version of the GUI (python with from fovea.graphics import gui), as we have already seen. Or you can create your own class, which subclasses diagnosticGUI. The vanilla version is a global singleton instance defined with a plotter2D object at the bottom of graphics.py. For problems that can be solved with the suite of tools built in for diagnosticGUI and plotter2D, using the imported GUI should be sufficient. However, if you wish to create your own methods that interact with diagnosticGUI's internal attributes, a customized gui can be easily created.
from fovea import graphics

class customGUI(graphics.diagnosticGUI):
    def __init__(self, title):

        plotter = graphics.plotter2D()
        graphics.diagnosticGUI.__init__(self, plotter)

        self.fig = 'master'
        self.title = 'my_project'
        self.doi = [(0, 100),(0, 1)]

        name = 'layer_name'

        self.do_fovea_stuff(name)

    def do_fovea_stuff(self, name):
        self.addFig(self.fig,
            title= self.title,
            xlabel='x', ylabel='y',
            domain= self.doi)

        self.plotter.addLayer(name)
The class customGUI initializes graphics.diagnosticGUI as its superclass with a plotter object. Any instance of customGUI can be acted on by diagnosticGUI and plotter2D methods such as addFig() and addLayer(). In addition, new functions such as do_fovea_stuff() can be defined by the user and used like any other diagnosticGUI method.
In some circumstances, it is necessary to create a custom object that subclasses diagnosticGUI. diagnosticGUI.make_gen() is a method for creating PyDSTool generator models, which may vary enormously in form, depending on the user's needs. As such, make_gen() is left empty and will raise a NotImplementedError if called by the global singleton gui. It is up the user to override this method (by defining in the subclass their own method of the same name), if they wish to associate their own PyDSTool model with the GUI. Similarly, user_nav_func() will also be called when diagnosticGUI navigation keys (see next section, Callbacks) are pressed, even though it is left empty. The method is there to be overridden if some special behavior is desired during context object navigation.
Built-in Callbacks
Once a GUI has been created, arranged, and supplied its data and artists, Fovea provides a number of analysis tools for users. These tools include buttons, keypresses and pickers.
If buildPlotter2D is called with @param basic_widgets = True, the figure is created with a number of general-purpose buttons that can be clicked by the user. They are:
save
Saves the current figure as a .png image in the working directory. If the plotter is initialized with a diagnostic manager, it will save the image to the dm directory instead.
capturePoint
back
refresh
showTree
Prints the current graphical hierarchy to the command line, displaying the organization of artists, within layers, within figures.
timeBar
This slider will appear if buildPlotter2D is called with @param with_times = True. It can be used to increment or decrement the data's current time step. +dt and -dt buttons are also provided.
If buildPlotter2D is called with @param callbacks_on = True, a number of keypresses and pickers will be initialized for manipulating data as well:
Lines (key: "l")
Activates a line selector, then click and drag to create a line of interest (line_GUI). Lines can be repositioned with navigation keys or defined with PyDSTool Events. For more information on lines see the "Context Objects" section below.
Boxes (key: "b")
Activates a box selector, then click and drag to create a box of interest (box_GUI). Lines can be repositioned with navigation keys or defined with PyDSTool Events. For more information on lines see the "Context Objects" section below.
Snap (key: "s")
Activate with key press, then click near a Trajectory to "snap" a point to that trajectory. Finds the point on the trajectory nearest the click-coordinates and draws a Point2D artist there.
Grow Domain (key: ".")
Activate and then click a seed point, followed by a radius point. Draws a polygon centered at the seed, which continues to expand as long as the points at the polygon edges satisfy a user defined "domain criterion function". The user function can be assigned as follows:
gui.current_domain_handler.assign_criterion_func(my_func)
User's Spatial Function (key: " ")
Activate and click to return meta-data generated by a user created function at a given point. The meta-data consists of two dictionaries, one with scalar values and the other with vector values. Below is an example of a user created function for returning displacement vectors from datapoints to a clicked point (vector-valued dictionary) along with all their magnitudes (scalar-valued dictionary), and how to assign the user function to be seen by the keypress handler:
def get_displacements(x, y):
    """
    For given x, y coord arguments, returns two dictionaries keyed
    by datapoint number (1-N):
    distance from (x, y) and displacement vector to (x, y)
    """
    print("Last output = (mag dict, vector dict)")
    Fxs = []
    Fys = []
    Fs = []

    pts = datapoints

    ixs = range(len(pts))
    for i in ixs:
        Fx = x - pts[i][0]
        Fy = y - pts[i][1]
        Fxs.append(Fx)
        Fys.append(Fy)
        Fs.append(sqrt(Fx*Fx+Fy*Fy))

    return dict(zip(ixs, Fs)), dict(zip(ixs, zip(Fxs, Fys)))

gui.assign_user_func(self.get_displacements)
ISSUE: Fovea provides most user hooks by creating an empty function to be overridden (e.g., user_nav_func), these should be replaced with assign_funcs like the ones above (or the assign_funcs should be replaced with overridable empty functions like user_nav_func) so the style remains consistent and easy to learn. It would probably make more sense to go with assign_funcs, as the overrides can only be used if the user wants to subclass diagnosticGUI.
Note that these callbacks will only work in subplots in which they have been assigned during the call to arrangeFig. For example, if the figure is arranged like below, then all the callbacks will work, but only when clicking on the axes of the second subplot:
plotter.arrangeFig([1,2],
    {'11':
        {'name': 'BEFORE',
        'scale': [(-10,10),(-10,10)],
        'layers': clus_layers+['orig_data'],
        'axes_vars': ['x', 'y', 'z'],
        'projection':'3d'},
    '12':
        {'name': 'AFTER',
        'scale': [(-20,20),(-20,20)],
        'layers': clus_layers,
        'callbacks': '*',
        'axes_vars': ['a', 'b']},
    })
ISSUE: If the 'callbacks' value is not None, all are activated. 'callbacks' should instead receive a list, to activate them individually. ISSUE: Seems redundant to both have an initializing statement in buildPlotter2D and arrangeFig. initialize_callbacks should just be called in arrangeFig.
Selecting Data and Context Objects
Any artist on a 2D subplot can be picked by clicking on or near them. When an artist is picked, it is redrawn with a thicker line or bigger markers, and set as the currently selected object (found at diagnosticGUI.selected_object). The selected object can be either data or a context object, each represented by different class:
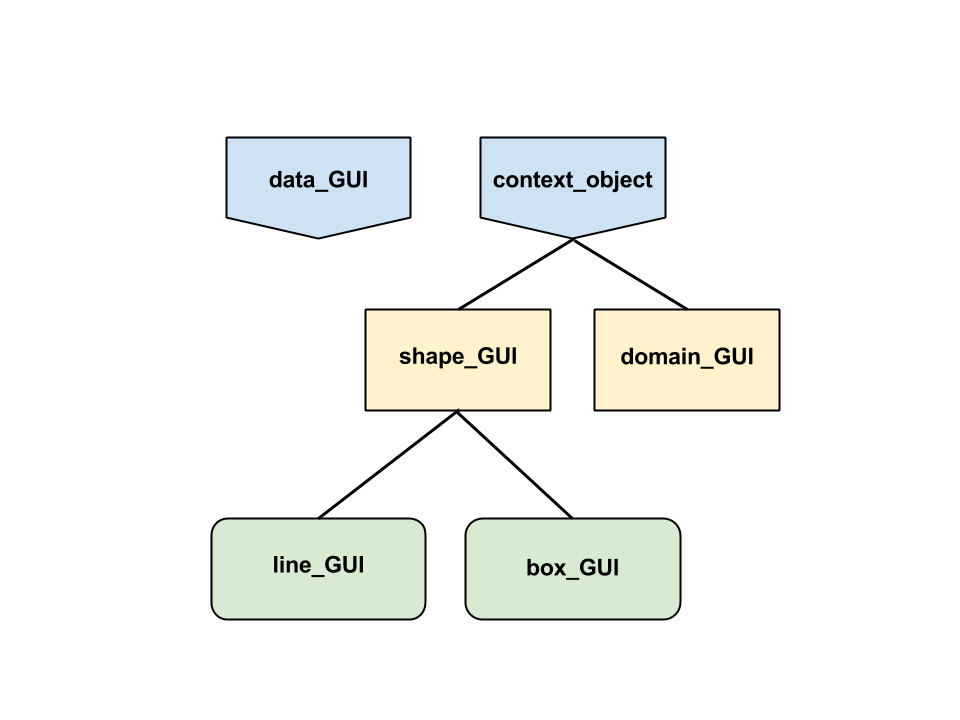
Class data_GUI
data_GUI s are a redumentary object implementation of clicked data (e.g., artists added to layers of kind = 'data'). They wrap up important properties of data in one place for easy reference. For instance, after picking a data selected object, the name, layer and handle of that artist can be retrieved from gui.selected_object.name, gui.selected_object.layer, gui.selected_object.handle.
Unlike context objects, data_GUIs are created the moment data are clicked, have no methods, and are forgotten about as soon as a new selected_object is clicked. They exist largely so that the functions for picking and setting selected objects behave consistently, whether data or context objects are picked. However, future versions of Fovea may flesh out this class with methods that provide more tools for handling data.
Class context_object
The context_object is an abstract base class representing objects created by the user for analyzing data. These currently include lines, boxes and growable domains. After a context_object has been created, it is set as the currently selected object and stored in the context objects dictionary found at gui.context_objects. The object's .name attribute serves as the dictionary key.
Class shape_GUI (subclasses context_object)
shape_GUI is the parent class of lines (line_GUI) and boxes (box_GUI) created with the "l" and "b" keypresses. Events can be created for shape_GUIs using .make_event_def(). For line_GUIs, these events will by triggered by crossing trajectories, for box_GUIs, they are triggered by trajectories crossing the box's main diagonal. shape_GUIs can also be manipulated using the navigation keys described later.
Class domain_GUI (subclasses context_object)
Polygonal domains grown by "." keypress. See the section on domain2D.py for more details.
When a context object has been selected an additional library of hotkeys can be used to manipulate, or navigate that specific object. Of the following, only the "up" and "down" error keys can be used on data_GUIs as well:
Move/Cycle ("up", "down", "left" and "right")
Translates context objects across the axes.
If data_GUI is selected, cycles between each data in the given layer as the selected object.
Delete ("backspace")
Removes the selected object from the axes and the context objects dictionary.
Force to Extent ("m")
line_GUIs only. Make the currently selected line horizontal (its y-intercept at the original line's midpoint) and span the axes.
Rename ("n")
Prompts user for string input and changes name of the selected object to that string. An object can also be renamed at the command line as follows:
gui.selected_object.update(name = "new_name")
ISSUE: Rename key causes "RuntimeError: can't re-enter readline".
Note also that selected objects can be set from the command line. It is crucial that manually selecting an object is performed with set_selected_object() and NOT with direct assignment of the .selected_object attribute.
CORRECT:
gui.set_selected_object(gui.context_objects["my_object"])
INCORRECT:
gui.selected_object = gui.context_objects["my_object"]
Assigning the .selected_object attribute directly will not update the data properties seen by plotter2D and buildLayer.
User Extensions
Users will inevitably run into the need to define their own keypresses. Fortunately, matplotlib can be used to add these to a user defined subclass of diagnosticGUI with little interference to Fovea (assuming the keys chosen are not already built into Fovea). The code snippet below is a rough-and-ready template for a diagnosticGUI subclass key handler. A more detailed demo (including instructions for a vanilla diagnosticGUI) can be found at the PCA Tutorial Blogpost.
class customGUI(graphics.diagnosticGUI):

    def __init__(self, title):
        plotter = graphics.plotter2D()
        graphics.diagnosticGUI.__init__(self, plotter)

        evKeyOn = self.fig.canvas.mpl_connect('key_press_event', self.ssort_key_on)

    def key_on(self, ev):
        self._key = k = ev.key  # keep record of last keypress

        if k == '1':
            do(x)

        if k == '2':
            do(y)

        self.plotter.show()
Note that the function name key_on() is the same used by Fovea's native key handler. Using this name will override Fovea's handler, thus rendering the built-in keypresses unresponsive. If a user wishes to retain the old keypresses in addition to adding new ones, a different name can be chosen. As such, before using a subclassed diagnosticGUI, it is important to familiarize onself with diagnosticGUI's functions to avoid overriding something important. However, not all function overrides are detrimental, and there are some instances in which Fovea even encourages them.
The following functions are defined and called inside Fovea, but are left empty. They as hooks where users can patch in some additional behavior to Fovea functions that often require tailoring.
user_update_func:
Called in _shape_GUI.update() . Since update is used to translate context objects, overriding user_update_func with a custom function can be used to trigger events or calculations whenever a user moves a context object. For an example see the spike sorting blogpost.
user_pick_func:
Called in _diagnosticGUI.pick_on(). Although only one object can be set as the selected object at a time, a user might want to highlight other objects or perform calculations whenever one object is picked. _user_pick_func receives the pick event, from which properties can be retreived (such as event.artist for the picked artist).
make_gen:
Called in diagnosticGUI.setup_gen(). Takes as input a dictionary of model parameters (@param pardict) and a model name (@param name) and creates a new generator model if one does not already exist. For an example, see examples/bombardier/fovea_game.py.
2. domain2D.py
In some applications, it may be necessary to monitor how the output of a function changes across the xy-plane. For instance, if a trajectory is being plotted through a vector field, the ability to highlight regions of the field where moving objects might get stuck could be invaluable. domain2D provides utilities for creating such "domains of interest" based on spatial variables in the xy-plane. It consists of two classes, polygon_domain and GUI_domain_handler, in addition to two functions, edge_lengths and merge_to_polygon.
polygon_domain is the fundamental shape object used in domain2D. An instance of polygon_domain includes a seed point c and a point p1, where the distance between c and p1 defines the initial radius of the polygon. The domain criterion function (saved as the attribute condition_func) is a user provided, two variable function mapping x and y to a scalar value. The method grow() uses these three attributes to iteratively expand the boundaries of the polygon, allowing it to swallow up nearby space where points within that space satisfy a certain condition. This condition is that the domain criterion function must output a scalar with the same sign given new points as it would given the c, the seed point. Note that the warning "f(p1) has different sign to f(c)" will occur if a p1 is chosen that fails to satisfy this condition. This behavior remains the same for all _polygon_domain_s, but by providing different domain criterion functions, the user can tailor domains to meet their needs.
GUI_domain_handler provides the needed interface between Fovea's domain2D and graphics utilities. A domain handler object allows users to assign a domain criterion function created in their own application to the polygon_domain (using assign_criterion_func().
class polygon_domain(object):
grow_step(self, verbose=False): Iterates over all of the exterior coordinates of of the domain polygon. Each time, increments the values of the points by a certain step size to create a new point. If the domain criterion function, given this new point, returns a value with the same sign as it would return, given the seed point, the new point is stored. Once all the original polygon points have been compared using boolfunc, a new polygon is made out of all the satisfying points.
self.boolfunc (implicit method). Performs a comparison to see if the output of the domain criterion function for a given input (a point) shares the same sign as the output at the seed point.
2. diagnostics.py
3. calc_context.py
4. common.py
COMMANDS
Graphics
MISC NOTES:
fig_struct is a dictionary produced as the first output of self._resolveFig(figure), it contains the fields: 'domain', 'arrange', 'xlabel', 'window', 'display', 'layers', 'autoscaling', 'title', 'fignum', 'ylabel', 'tdom', 'shape'. These are properties of the master window/ figure itself. It can also be accessed within the plotter2D class with self.figs[figure_name], which is what ._resolveFig does.
figure, output as the second argument of self._resolveFig(figure), is just a string. The name of the figure fig_struct describes (e.g., 'master')
layer_struct is a dictionary associated with a unique, named layer. It contains the fields: 'scale', 'kind', 'style', 'data', 'dynamic', 'zindex', 'axes_vars', 'trajs', 'display', 'handles'. These are the properties of the layer named in the call to self._resolveLayer(figure, layer). Each layer has its own struct.
The value of the 'data' key in layer_struct is a dictionary, whose keys are 'style' (string), 'display' (boolean) and 'data' (numpy array)
arrangeFig checks if positions of the subplots are consistent with the declared shape, and if so, stores shape and arrange as items in the fig_struct. These are used later to actually build the figure and plots.
Class Line_GUI
Line of interest context_object for GUI.
Methods:
distance_to_pos(self, dist)
Calculate absolute (x, y) position of distance dist from (x1, y1) along the line instance.
fraction_to_pos(self, fraction)
Calculate absolute (x,y) position of fractional distance fraction (0-1) from (x1, y1) along line
make_event_def(self, uniquename, dircode=0)
Binds an event to this instance of line_GUI, which is triggered when the line is crossed by some trajectory. uniquename determines the name of the event and dircode specifies whether the event should be triggered by a crossing from the left, right, or either (must be -1, 0 or 1).
Class diagnosticGUI
Methods:
buildPlotter2D
Creates GUI based on the properties set with arrangeFig. Takes as input a fig_size (integer pair), which gives the width and height of the master window in inches, and with_times (boolean), which determines if a continuous "time slider" widget should be created. Creates core GUI buttons and sets up their callbacks.
subplot_struct contains the values for a subplot at a given position named in the call to arrangeFig
unshow(self)
Make this line instance invisible.
Class Plotter2D(figSize, with_times)
Responsible for management and creation of Fovea layers and graphical objects contained inside them.
List of plotter2D attributes:
self.dm
Diagnostic manager object passed into constructor.
self.save_status
Boolean
self.wait_status
Boolean
self.figs
Dictionary containing figure names as keys and fig_structs as values.
self.currFig
self.active_layer_structs
Methods:
addText(self, data, figure=None, layer=None, style=None, name=None, display=True, force=False, log=None)
Does NOT accept a list of text/list of position coords to create text en mass.
addData(self, data, figure=None, layer=None, style=None, name=None, display=True, force=False, log=None)
""" User tool to add data to a named layer (defaults to current active layer). data consists of a pair of sequences of x, y data values, in the same format as would be passed to matplotlib's plot.
Use force option only if known that existing data must be overwritten. Add a diagnostic manager's log attribute to the optional log argument to have the figure, layer, and data name recorded in the log.
display option (default True) controls whether the data will be visible by default. """
Creates a name for the data parameter in this layer, and adds it to layer_struct.data as a dictionary of dictionaries with the builtin update() method defined for dictionaries. The sub-dictionary's keys are 'data' (the np array passed in as an argument), 'style', and 'display'.
addLayer(self, layer_name, figure=None, set_to_active=True, **kwargs)
Add a layer to the figure. layer_names can be created or stored, but they can also be initialized with layer properties such as data, style, scale and kind.
Basically takes a new figure name, and associates with that string its own figure_struct
setLayer(self, label, figure=None, **kwargs)
Arrange data sets in a figure's layer
Change or reset properties of an existing layer named label. Note that plotter2D.show() must be called afterwards in order to update layer axes.
Valid kwargs:
data
numpy array of numeric data
dynamic
boolean variable
zindex
style
Maximum two character string indicating color and/or style of plotted data (e.g., "r." for a red dot)
display
boolean determining visibility of layer
axes_vars
List of strings labeling each axis.
handles
Ordered Dictionary of mpl handles belonging to artists in the layer. The keys correspond to names of the data stored in the data field (i.e., they should have a one-to-one correspondence with layer_struct.data.keys after the artist has been drawn with a call to buildLayer), each valued with a single matplotlib object. An ordered dictionary is used to facilitate cycling between handles in a single layer with keypresses (see the section on navigation callbacks for more information)
trajs
A dictionary of PyDSTool Trajectories belonging to artists in a layer. The keys correspond to names of the data stored in the 'data' field, each valued with a single PyDSTool Trajectory created by the internal function _updateTraj().
scale
kind
string indicating kind of information displayed in this layer (e.g., "text", "data").
_subplots(self, layers, fig_name, rebuild= False)
Nested loop over shape provided in fig_struct. Retrieve the subplot_struct ('name', 'projection', 'layers', ... Things defined in arrangeFig) Each time through the loop.
EXAMPLES
Bombardier
Bombardier is a simple game that simulates the trajectory of a projectile as it travels past bodies with gravitational fields. The user sets the speed and angle of the projectile before each run and initiates the simulation by pressing the "Go!" button at the bottom left of the window (or pressing the hotkey 'g').
Four games are included in the Bombardier example folder (though currently only games 1, 2 and 4 are implemented).
User key commands (defined in bombardier.GUIrocket.key_on):
'g'
Runs the simulation with current angle and velocity
'l'
Click and hold to create a new line_GUI object as a straight line in the current axes. The new instance of line_GUI is stored in GUIRocket.context_objects and game#.selected_object.
' '
Creates a new selected objected at next clicked mouse point.
's'
Snap next clicked mouse point to closes point on trajectory.
'.'
Click on domain seed point, then initial radius point.
Class GUIrocket
Methods:
get_forces(self, x, y)
Function used by mouse_event_force, tied to the ' ' callback.